
The first screen of the workspace counts your validation runs. Open Dashboard in the sidebar; the page itself is titled Statistics. It answers two questions: how much the analyzer is being used, and what it keeps finding.
Every figure on it comes from your own runs only — from the Validator screen and from your assistant alike. Nobody else's runs are counted, and nobody else sees yours.
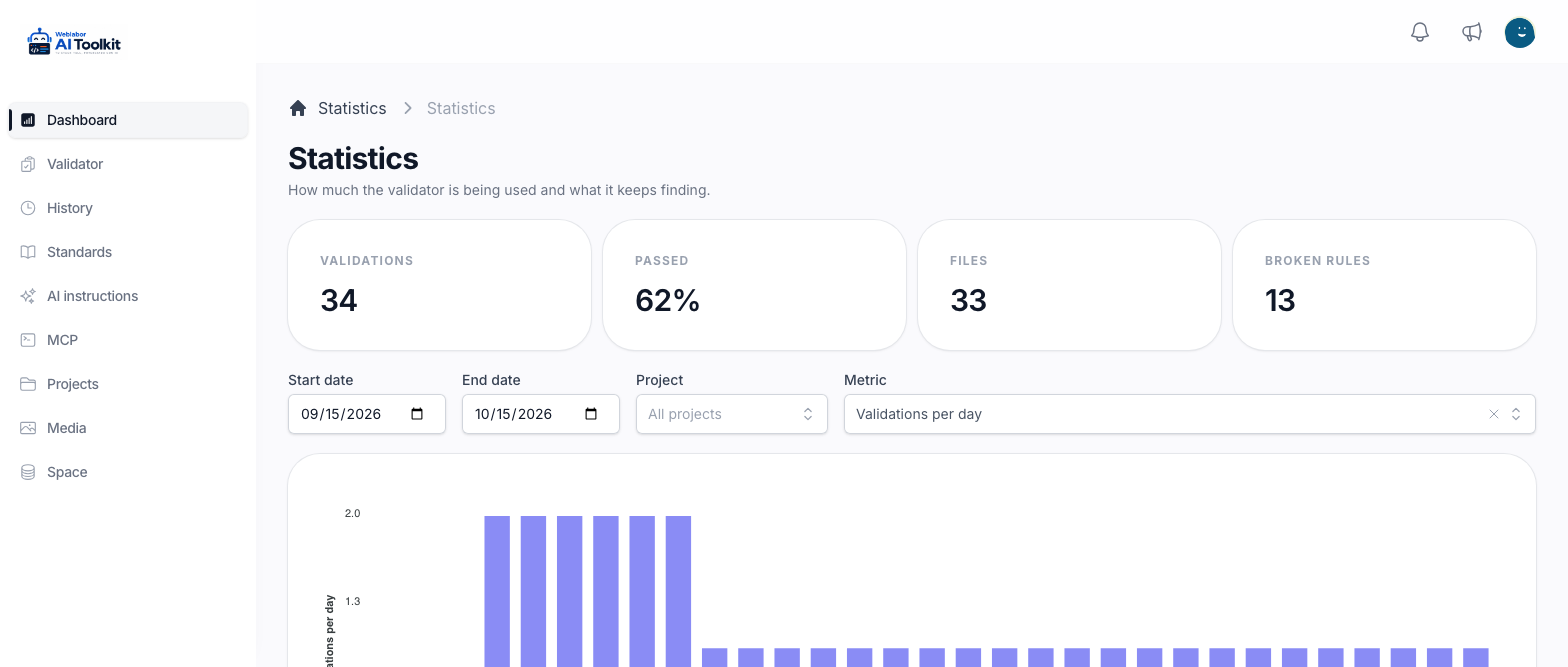
The four cards
| Card | What it counts |
|---|---|
| Validations | The runs in the range |
| Passed | The share of those runs that passed, as a percentage. It shows a dash when there are no runs |
| Files | How many different files were analysed. A file run five times counts once |
| Broken rules | Every time a rule failed in one of those runs. A rule that failed in three runs counts three times |
The cards follow the same filters as the chart below them.
Choose what to look at
- Start date and End date set the range. The page opens on the last 30 days. If the start comes after the end, the two are swapped rather than refused.
- Project keeps the figures of one project only. All projects counts everything, and No project gathers the runs that never named one — every run made before projects were recorded, and any run sent without a project.
- Metric chooses what the chart draws.
Every change redraws the cards and the chart at once; there is nothing to press. The project and the metric you chose stay in the page address, so the link brings you back to the same view. The dates do not: the link opens on the last 30 days again.
The six metrics
| Metric | What the chart shows |
|---|---|
| Validations per day | How many runs there were in each period. This is the one the page opens on |
| Passed vs failed per day | The same runs split into Passed and Failed, side by side |
| By origin | Runs grouped by where they came from: Web validator, MCP, Background job or Legacy |
| Most broken rules | The ten rules that failed most often in the range |
| By file type | Runs grouped by the type of file analysed |
| By project | Runs grouped by project, with No project for those that named none |
The three that run over time group the runs by day while the range is under 50 days. A longer range is grouped by week, then by month past six months, and by year past three years, so a long range still fits on one chart.
What each origin means is explained in The analysis history.
Reading it
Most broken rules is the one to open when a team keeps making the same mistake: a rule at the top of it for weeks is worth a conversation, or a closer read of the rule itself in Read the standards.
Passed vs failed per day says whether a project is getting cleaner. A failed run is not a problem in itself — it is the analyzer doing its job before the file ships. What matters is whether the failed column shrinks as the weeks go by.
To see the runs behind a figure, with their code and their findings, go to The analysis history.
Next
- Analyse a file — the two ways to start a run.
- Read a finding — what a rule reported and how to fix it.